
As I’ve been warning about since last year, central banks across the globe — but particularly in Russia, China, India, and Turkey — have been buying up more gold than they ever have.
This is bad news because it means they’re expecting (or perhaps even manufacturing) an economic downturn far worse than what we’ve already seen. Precious metals are long-term holds which goes against the central banks’ penchant for flexibility in moving money across markets. For them to be buying gold the way they have been since last year means they’re not expecting the “soft landing” we keep getting lied to about by Janet Yellen and her ilk.
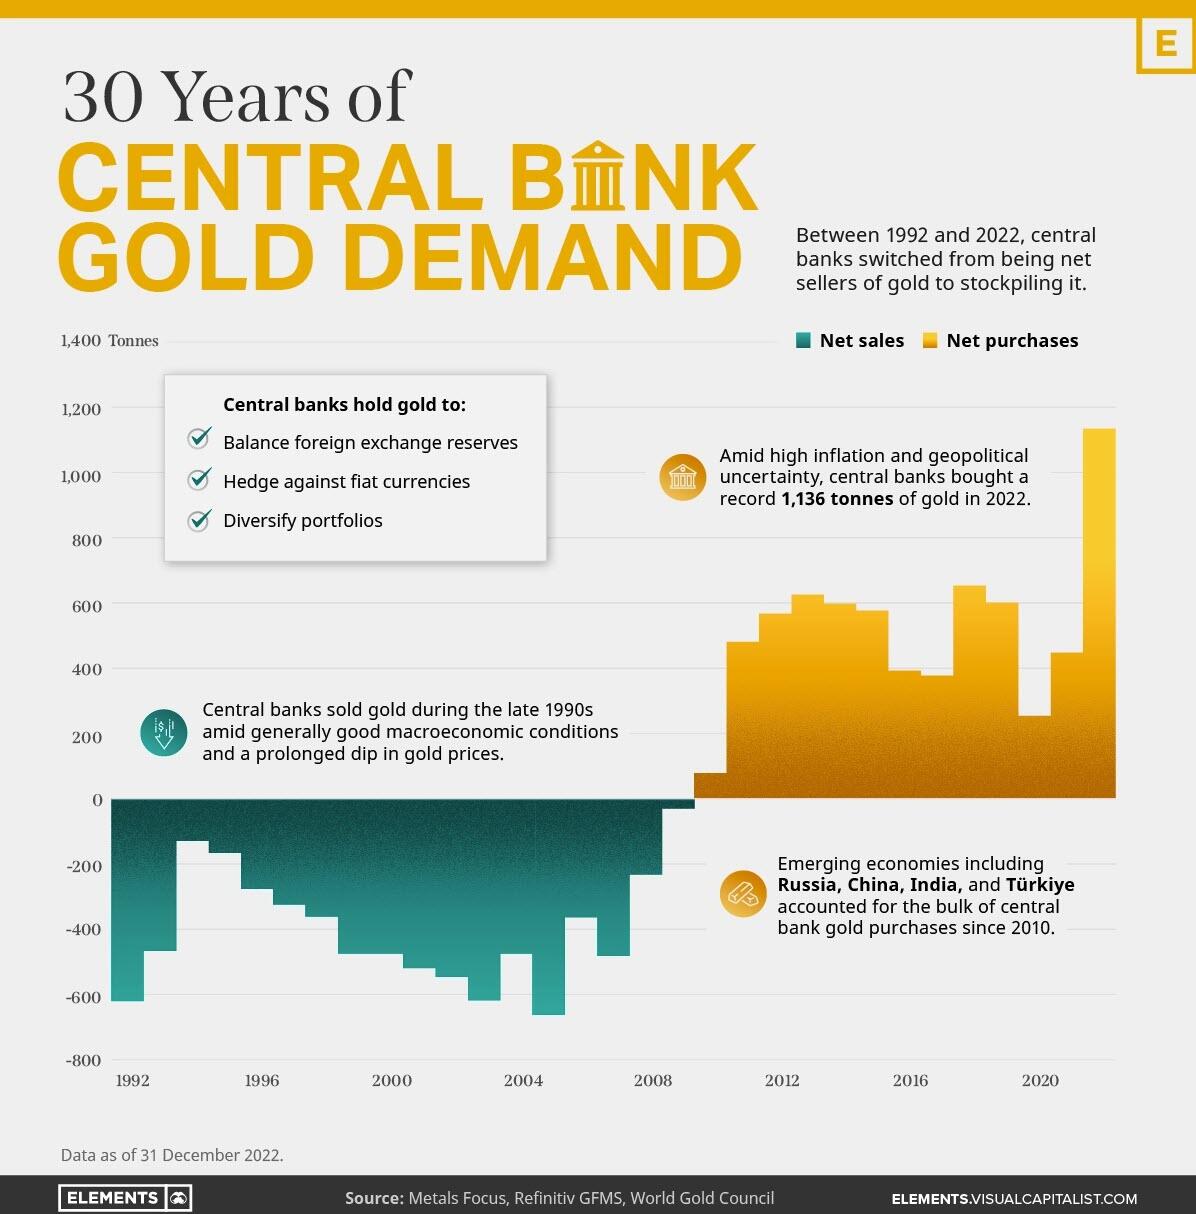
Here’s a chart by Visual Capitalists that clearly shows the shocking trend:
According to Zero Hedge:
Did you know that nearly one-fifth of all the gold ever mined is held by central banks?
As Visual Capitalist’s Govind Bhutada details below, besides investors and jewelry consumers, central banks are a major source of gold demand. In fact, in 2022, central banks snapped up gold at the fastest pace since 1967.
However, the record gold purchases of 2022 are in stark contrast to the 1990s and early 2000s, when central banks were net sellers of gold.
The above infographic uses data from the World Gold Council to show 30 years of central bank gold demand, highlighting how official attitudes toward gold have changed in the last 30 years.
With central banks continuing to buy gold, not to mention the emerging banking crisis, many Americans are moving wealth or retirement to precious metals. Here’s a brief explainer about why and how it’s done.
Leave a comment about this post on my economic Substack.